EU Taxonomy Software

Systematic capture taxonomy-relevant business activites

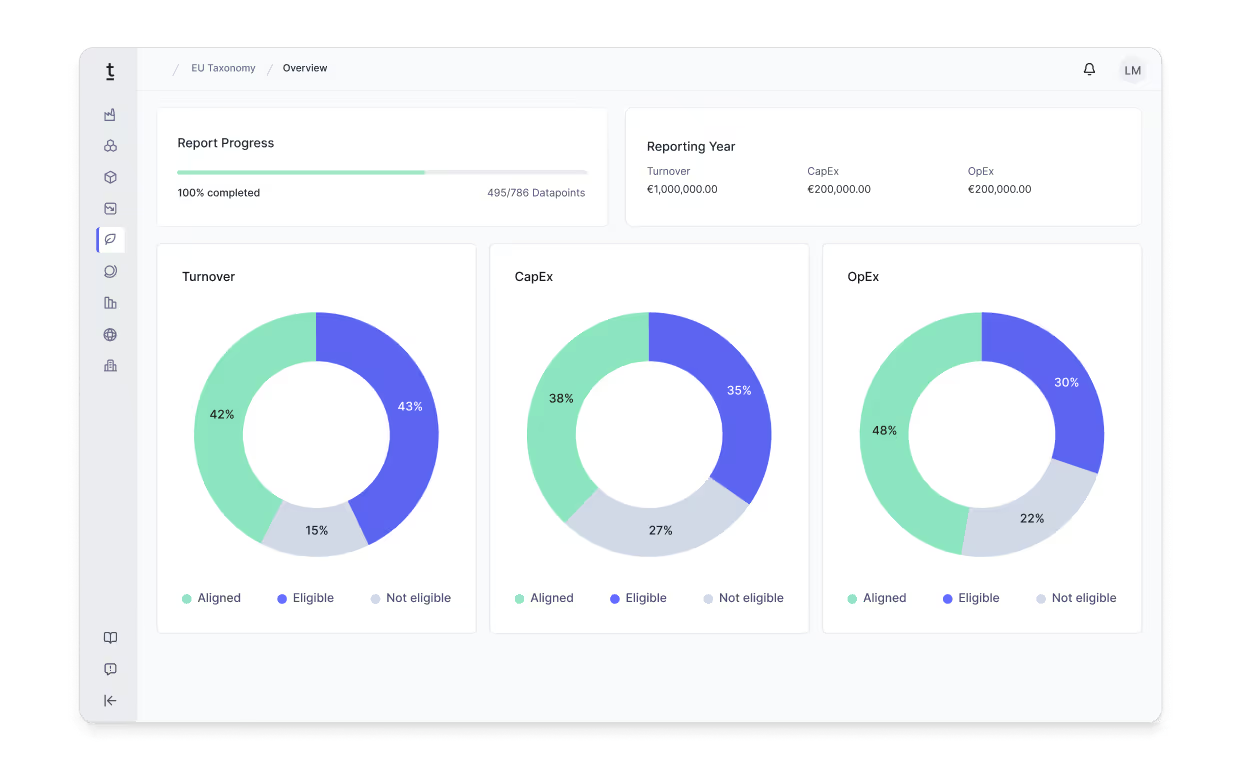
Track taxonomy-relevant activities, ESG data, and work areas – including eligibility assessment and taxonomy alignment directly in Tanso. Optimized for manufacturing SMEs.

Establish audit-proof processes and simplify EU Taxonomy reporting

Audit-proof processes

Streamlined compliance: Fulfill CSRD, EU Taxonomy, and GRI with ease.

AI-powered sustainability analysis

Identify optimization potential in your ESG data and define targeted actions to improve your sustainability performance.

Productivity through data synergies

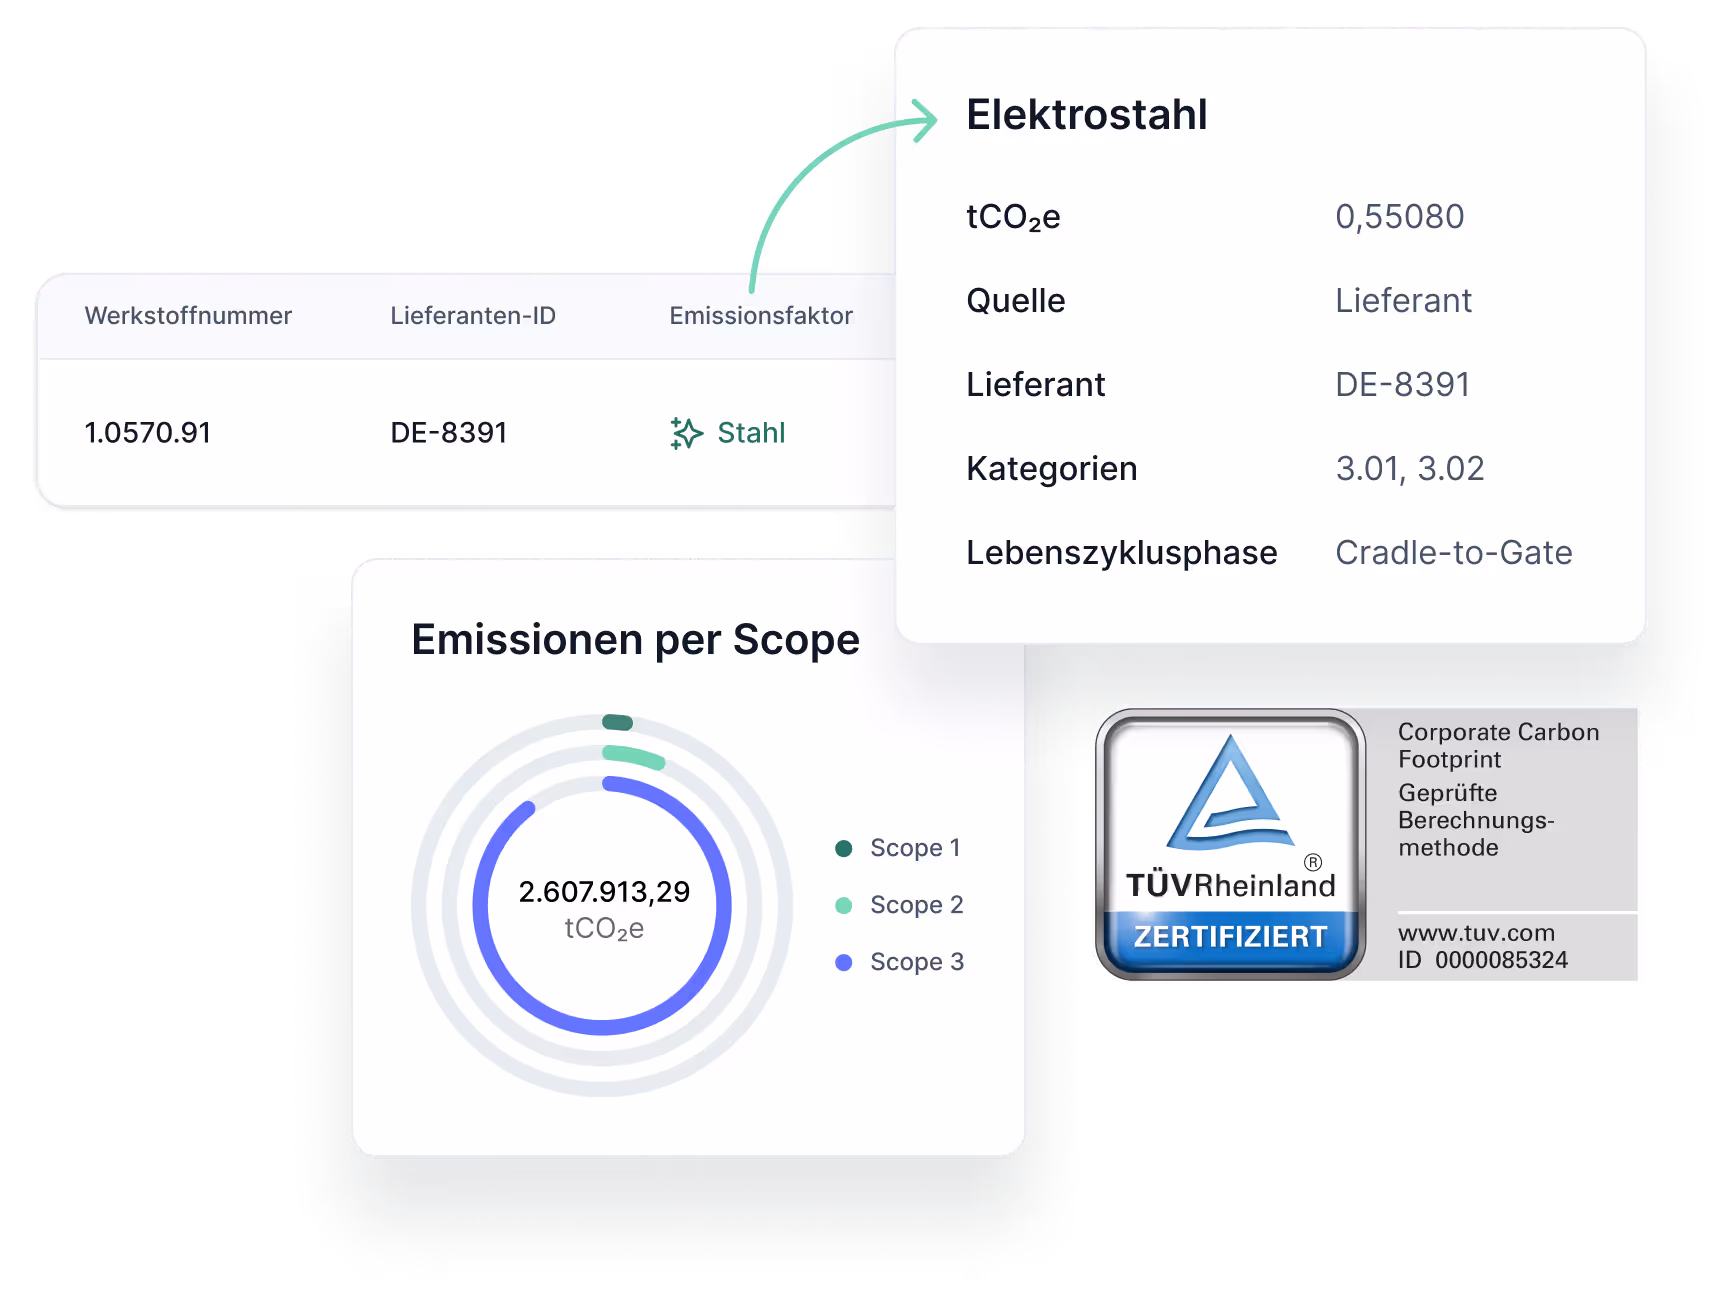
Central integration of CCF, PCF, and CSRD data.

Assessment of Taxonomy Eligibility

  • Select company activities from the taxonomy activity database
  • Determine eligibility of economic activities
  • Quantify activities based on the 3 KPIs: revenue, CapEx, and OpEx

Review of taxonomy alignment

  • Step-by-step guides for determining substantial contributions, "Do No Significant Harm" (DNSH), and "Minimum Social Safeguards" (MSS) criteria
  • Simplified compliance checks with visual indicators
  • Centralized collection of receipts or documentation to demonstrate compliance

Result analysis

  • Quantified summaries of EU Taxonomy compliance and related economic impact
  • Efficient reporting aligned with EU standards using in-app templates

Publication of audit-ready reports

  • Seamless integration with CSRD reporting in a consolidated sustainability statement
  • Audit-readiness through document uploads and audit trails per activity
  • Cost-effective audits through dedicated auditor access
Übersicht der Aufgaben für 2024 zur Emissionsdatenerfassung in Kategorien wie Logistik und Strom, mit Statusupdates und der Möglichkeit, Vorlagen herunterzuladen oder Dateien via Drag & Drop hochzuladen.
Darstellung der CO₂-Emissionen von Elektrostahl mit Werkstoffnummer, Lieferanten-ID und Lebenszyklusphase, ergänzt durch ein Kreisdiagramm zu Emissionen per Scope und ein TÜV-Zertifizierungslabel.
Balkendiagramm zeigt Emissionen pro Werk (Shanghai, Geisingen, Kassel), während KPI-Karten die Emissionsintensität pro Mitarbeiter, Euro, kWh und m² mit Veränderungsraten anzeigen.
Balkendiagramm zur Emissionsreduktion durch Initiativen im Vergleich zu “Business as usual”, ergänzt durch Detailangaben zu einer E-Auto-Umstellung, einschließlich erwarteter Emissionsreduktion und Kosten.

What our customers say

Resources for reliable EU Taxonomy reporting

Corporate carbon footprint

Machen Sie sich Nachhaltigkeit einfacher. Mit unserem CO₂-Rechner.

Profitieren Sie von der Präzision der Tanso-Software – optimal abgestimmt auf die Anforderungen der fertigenden Industrie.

Datenerfassung

Eröffnen Sie in wenigen Minuten Ihr Konto und setzen Sie Ihr Profil auf. Fordern Sie standort- und fachabteilungsübergreifend effizient Daten an. Nutzen Sie hierfür Datenanfragen über unser Aufgabenmanagement oder unseren Rohdatenupload für Excel/CSV-Dateien. Für umfangreiche Datensätze können Sie alternativ auch unsere API nutzen.

  • Cloud-basierte Zusammenarbeit
  • Intuitives Projektmanagement
  • Unkomplizierte Verarbeitung tausender Datenpunkte
Produkt Screenshot der Tanso CO2 Bilanzierung Software mit Darstellungen zur Erfassung von Daten.
Produkt Screenshot der Tanso CO2 Bilanzierung Software mit Darstellungen zur Berechnung von Emissionen.

Emissionen berechnen

Ermitteln Sie Ihren direkten und indirekten CO₂-Fußabdruck (Scope 1-3) über unsere benutzerfreundliche Web-App. Nutzen Sie Tansos umfassende Emissionsfaktoren-Datenbank oder erstellen Sie eigene, lieferantenspezifische Faktoren, um noch genauere Werte zu erhalten.

  • Automatisierte Berechnung Ihres CO₂-Fußabdrucks
  • Zugang zu allen öffentlichen Emissionsfaktoren 
(einschließlich D-BEIS/DEFRA, ProBas, EPA)
  • Speziell für Industrieunternehmen entwickelt

Emissionen verstehen

Ermitteln Sie Ihre Emissionen nach Produktgruppe, Standort, Lieferant oder Abteilung, um Emissions-Schwerpunkte zu identifizieren. Mit unseren Analysen finden Sie heraus, wo sich Emissionen in Ihrem Unternehmen konzentrieren und können gezielt in den Austausch mit Fachabteilungen gehen.

  • Umfassende Transparenz aller Emissionen
  • Detaillierte Aufschlüsselung nach Hauptsegmenten
  • Effiziente Identifizierung von Schwerpunkten
Produkt Screenshot der Tanso CO2 Bilanzierung Software mit Darstellungen zur Co2 Reduktion.

Fußabdruck reduzieren

Entwickeln Sie eine datengestützte Dekarbonisierungsstrategie, legen Sie Ihre Emissionsziele fest und überwachen Sie Ihre Fortschritte genau. Erarbeiten Sie Dekarbonisierungspläne und vergleichen Sie Ihre Ziele mit den Standards der Science-Based-Targets Initiative (SBTi).

  • Mehr Kapazitäten für wertschöpfende Maßnahmen
  • Klare Zielsetzung gemäß SBTi oder den eigenen Zielen
  • Initiativen-Controlling für effektive Dekarbonisierung

Ergebnisse kommunizieren

Kommunizieren Sie Ihre Fortschritte. Mit Tanso informieren Sie Kunden, Regulierungsbehörden und andere Interessensgruppen mühelos über Ihren CO₂-Fußabdruck, der anerkannten Standards (GHG-Protokoll, GRI, ISO usw.) entspricht.

  • Erstellung berichtsfertiger Daten auf Knopfdruck
  • Sicherstellung von Konformität mit gängigen Standards 
(GHG-Protokoll, GRI, ISO 14064)
  • Tanso als Single-Source-of-Truth für die Berichterstattung
Faq

Frequently asked questions about Tanso

Implementation, regulatory details, and more. Find your answers here.

What does taxonomy-conform mean?

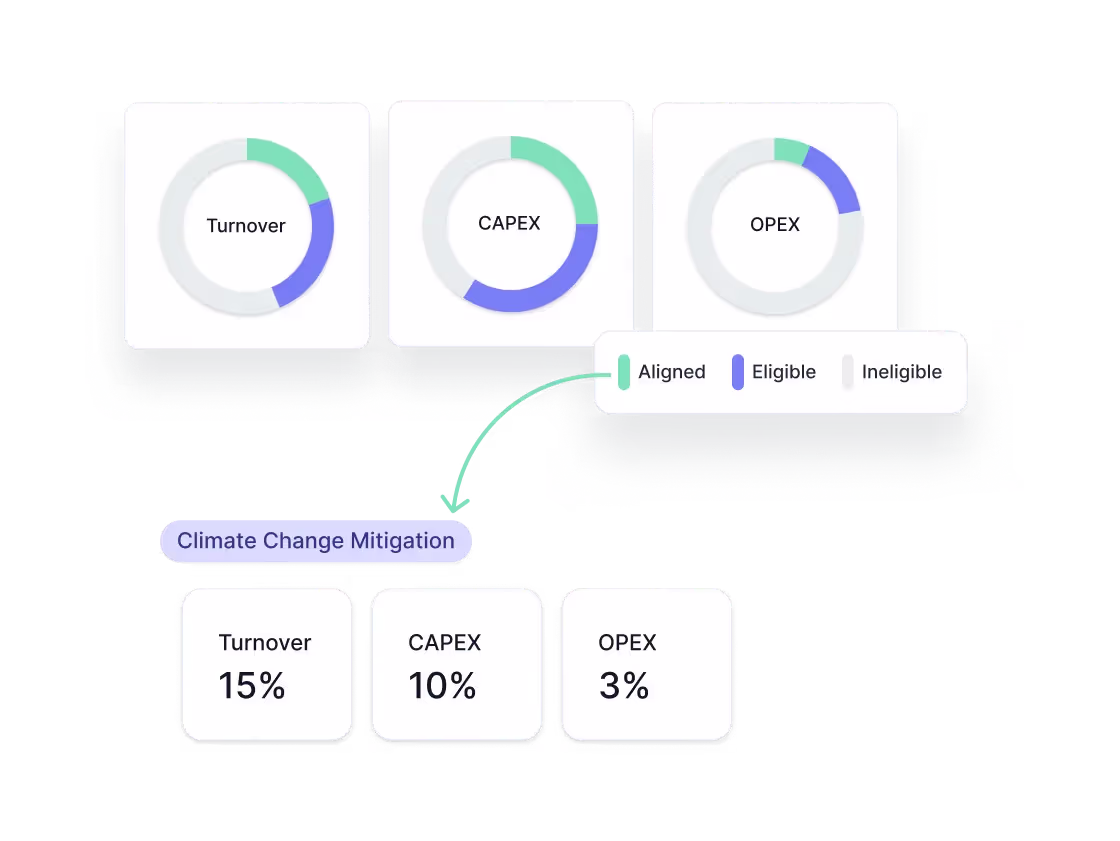
Taxonomy-conformity means that an activity is not only taxonomy-compliant, but also fulfills all the necessary criteria of the EU taxonomy. It must contribute significantly to at least one environmental objective, not significantly harm the other environmental objectives (Do No Significant Harm principle), comply with the minimum protection measures and meet the applicable technical assessment criteria. A taxonomy-compliant activity is therefore fully in line with the requirements of the EU taxonomy.

What does taxonomy-eligibility mean?

Taxonomy-eligibility means, that an economic activity basically fits into the categories of the EU taxonomy and can be assigned to one of the defined environmental objectives. The activity is therefore relevant for the taxonomy, but it has not yet been assessed whether it meets the requirements of the EU taxonomy.

When does a company have to report on the EU Taxonomy?

Companies must report on the EU Taxonomy if they fall under the Corporate Sustainability Reporting Directive (CSRD) or the Non-Financial Reporting Directive (NFRD).

How are the EU Taxonomy and CSRD connected?

The CSRD and the EU Taxonomy complement each other and work closely together: All companies that are required to report under the CSRD must also report on the EU Taxonomy.Both reports ultimately feed into the sustainability statement in the management report.

What is the EU Taxonomy?

The EU Taxonomy is a transparency tool based on a clearly defined classification system. It translates the EU's climate and environmental goals into specific criteria for certain economic activities, and thus serves as a guide for private investment in sustainable projects.