Accurate PCF data through automated processes, TÜV-certified methodology, and ISO 14067 compliance. Less complexity and more transparency for customers and stakeholders.


"Today, I can calculate in five minutes how much CO₂ we would save by electrifying a furnace. This level of flexibility would have been impossible in the past."


"With Tanso, we reduced the effort required for PCF calculations from 1.5 hours to a single click - while simultaneously increasing transparency and data quality."


"With the PCF created in Tanso, we efficiently meet growing customer demands for reliable sustainability data and gain a clear competitive advantage through verifiable data in tender processes. At the same time, the generated PCFs also enable us to fulfill contractually agreed customer requirements."


“With Tanso, we reliably and automatically collect the data relevant to our PCF. This reduces complexity, improves data quality, and enables us to respond to customer inquiries quickly and with confidence.”


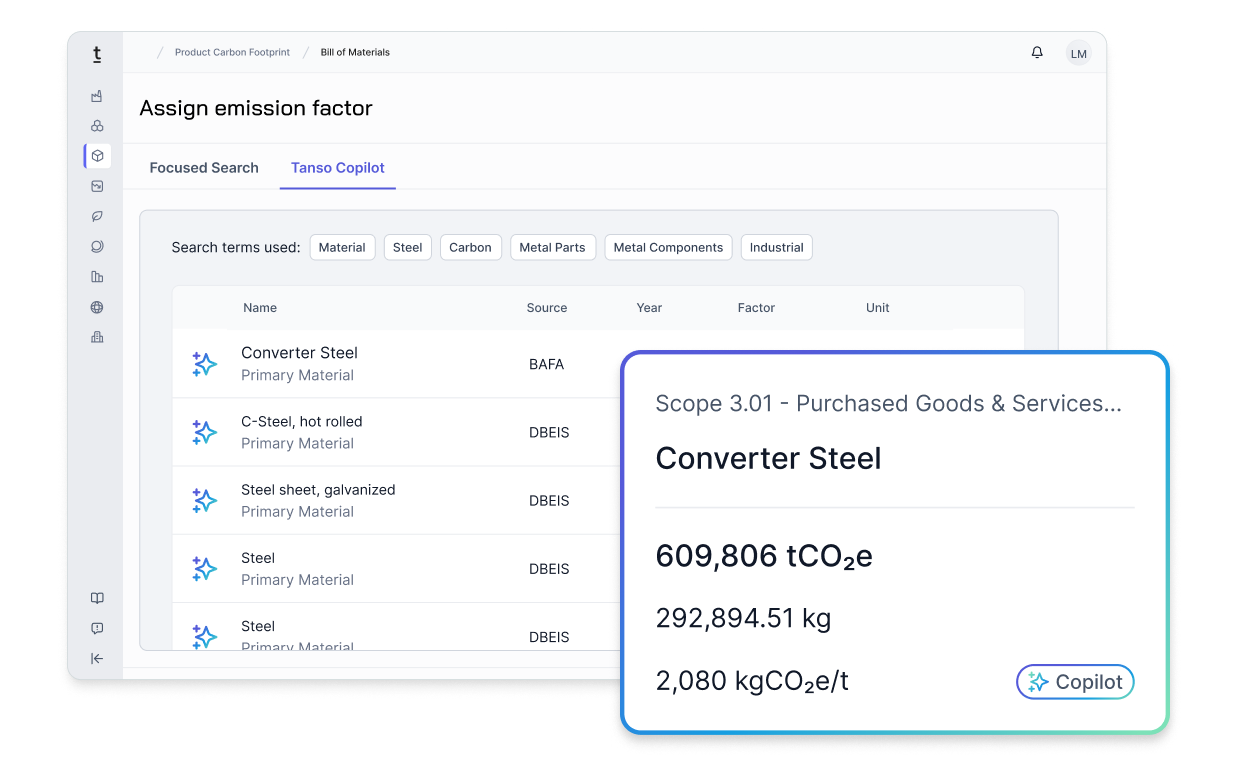
“Tanso’s integrated emissions factor database helps us quickly find suitable factors – including for specific products like furniture thanks to ongoing updates. This saves research effort and provides a solid data foundation for reliable PCFs.”

“The seamless integration of PCF and CCF data has significantly accelerated our processes – we’re now much faster and avoid redundant work. What used to take almost a full day is now done within a few hours. In addition, our customers also appreciate the quality and informative value of the PCF reports.”


“For us at FEP, it is particularly important to efficiently determine PCF calculations for product groups and product variants. In Tanso, simply duplicating and adapting the PCFs helps me. As a result, I was able to calculate multiple PCFs in a very short time.”

"I am positively surprised by the comparability of the results between PCF STARTER, developed by Tanso in cooperation with VDMA, and the much more comprehensive life cycle analysis (LCA) that HEIDELBERG uses for products. Thanks to the simplicity of the tool, PCF STARTER is recommended for all manufacturers who want to start with product-specific carbon accounting. The tool is great to identify emission hotspots."
.avif)


.png)

"The Tanso software enabled us to identify the relevant data and process as well as analyze large volumes of information in a short time. This allowed us to allocate corporate emissions proportionally to the respective product groups. These valuable insights provide the basis for concrete reduction measures."

Christian Bracke


“With Tanso, we have taken our CO₂ accounting to a new level. Automation and precise data collection not only enable faster processes but also provide the foundation for well-informed decisions in our sustainability strategy.”
Daniel Rabe


“Thanks to the Tanso software, we were able to independently complete the accounting of Scope 1–3 in just two months – a 75% time savings compared to the eight months required with external consulting.”

Jan-Oliver Hense


Implementation, regulatory details, and more. You can find the answers to all of this here.
The corporate carbon footprint (CCF) is a key indicator for supplier portals and rankings/ratings. OEMs are increasingly demanding transparent and measurable sustainability data in order to reduce the environmental impact along the value chain. It is also crucial in assessment models such as those of EcoVadis or the CDP, as these take climate performance into account as an important criterion.
The following is an excerpt from the available databases:
GHG protocol: A globally recognized standard for recording and reporting greenhouse gas emissions.
ISO 14064: Focuses on quantifiable, auditable reporting at company level.
ISO 14067: Refers specifically to the greenhouse gas balance of products.
CDP: Platform for disclosing environmental information such as emissions and climate risks.
GRI: Standards for comprehensive sustainability reporting, including environmental, social and governance issues.
Scope 3 emissions account for around 90% of a corporate carbon footprint, but the data is often difficult to access. Its collection requires close cooperation with suppliers, and complex calculation methods lead to uncertainties in accuracy.


